Tutorial · Research edition
Microphone Sibilance: Fix Harsh S Sounds
Trace harsh S and SH sounds through your recording. Compare five original measured WAVs to see what permanent, timed-band and whole-signal reduction change.
If S and SH sounds feel unusually sharp in a microphone recording, keep an untouched phrase and find where the change appears. A sound already in the saved source needs a different comparison from one introduced by an effect or heard only through one playback route. Locate the stage before choosing how much to remove.
A useful comparison includes the troublesome consonant and the wanted sound around it. Our five original downloadable examples separate where gain acts from when it acts. They make the arithmetic measurable; their tones are not a voice, and resembling a fixture cannot diagnose your microphone.
Keep the untreated phrase and locate the changing stage
- Save an untouched recording and make a working copy. Mark a short phrase with an S or SH sound that concerns you and a nearby phrase that you want to preserve. Record the microphone, connection, application, enabled effects and output route; leave unknown details unknown.
- Play the same saved phrase in another player at a fixed low device volume. If practical, compare a known working output route. A difference confined to one listening path calls for investigation of that path; a difference that follows the file was captured or applied before that file was saved. This does not identify a hardware cause.
- Compare the saved source with the project and a short reopened export. Note whether a particular enabled effect creates or exaggerates the change. Bypass one reversible processing stage on the copy, recording its previous setting. Preserve call protections and the original session.
- For a new capture test, keep speaking effort and position reasonably consistent. Use the existing microphone-technique guide for placement comparisons, then record and play back the result. A live monitor alone does not establish what the file contains.
Choose the next check from the actual symptom
The words “harsh”, “hissy” and “distorted” can describe different observations. These checks narrow an investigation; they do not establish a cause.
- The problem follows particular S or SH sounds — mark those moments and inspect a suitable frequency range in the saved copy. Compare the rest of the phrase before accepting processing.
- A similar hiss continues through pauses — investigate the continuous background separately. A consonant-targeted processor is not evidence that you have identified the noise source.
- Louder passages sound damaged or flattened — use the Crackling or Popping guide’s overload comparison. A quiet final peak meter does not clear earlier stages.
- Words disappear or become unnaturally changed after cleanup — compare the original with that processing stage. The Noise Gate and AI-cleanup guides cover related failure boundaries.
- Only one headphone or playback route sounds unusually bright — compare that route before using a permanent correction on the recording.
Inspect what the processor listens to and what it turns down
Adobe’s Audition DeEsser documentation distinguishes Broadband, which compresses the full frequency range, from Multiband, which processes the sibilance range. It documents Threshold, Center Frequency, Bandwidth and Output Sibilance Only for locating the detected material. Those are controls described for that product, not a preset for every voice.
Softube describes Wide as full-spectrum processing and Split as processing above its high-pass setting. Its audition controls let the user inspect detector content and removed content. These product-specific definitions matter: do not treat every control called “split”, “multiband” or “frequency” as the same crossover or detector. Neither application was run for this article.
On a copy, use the available audition function to locate the intended material at a low level, then return to the complete phrase. If the selected range captures wanted content as well, record that tradeoff. A detector display describes a tool’s activity; it does not by itself prove the recording is repaired.
Check the wanted sound between the troublesome moments
Listen to the troublesome consonant, a following vowel or word, and an unaffected phrase. Compare all three before and after the change. A reduction that helps one moment can also change surrounding material. Keep the original available and make one reversible change at a time.
Softube warns that excessive de-essing can create a lisping result. Our last fixture does not synthesize that speech defect: it removes a known high marker through a deliberately extended interval. The numerical result illustrates extra removal, while a real voice still needs its own listening and word-content check.
Audacity’s Plot Spectrum documentation describes an FFT view of selected audio and explains that selection, block size and window affect the display. Use a documented analysis view to inspect the same passage consistently. A whole-file spectrum can hide when a change happened. Our component projections below are explicitly defined coherent measurements, not screenshots or reproductions of Audacity’s Plot Spectrum.
Our measured example: five files with known components
All five files contain eight seconds of mono 48 kHz PCM16. The low component contains 220 Hz and a smaller 660 Hz tone. A separate, continuous 6 kHz tone is a wanted high-component measurement marker. Three 20-tone bursts occupy 5.1–8.9 kHz, with no burst tone at 6 kHz, at 1.0–1.4, 3.2–3.6 and 5.4–5.8 seconds. They are a constructed multitone, not noise, speech or an acoustic model of S and SH sounds.
The reference contains the low component, wanted high marker and bursts. File 2 multiplies the entire known high component by 0.25 throughout. File 3 applies a known gain schedule to that component only: 1 between bursts and 0.25 in their steady centres. File 4 applies the same schedule to the complete mixture. File 5 removes the high component through the burst and for 250 ms afterwards, with explicit 10 ms gain ramps.
The timings come from construction metadata. There is no automatic detector, estimated sibilance band, physical filter split, crossover, lookahead or modeled vendor algorithm. In particular, the permanently reduced file is not the output of a real equalizer. These exact component operations isolate where and when gain acts; real processors require separate verification.
Each burst has 10 ms half-cosine edges. A 50 ms outer fade is applied after processing. Samples are rounded once to PCM16 with nearest-even rounding and a 32767 multiplier, without dither, normalization or limiting. Levels are decoded with a 32768 full-scale denominator. The chosen frequencies, timing and gain factors are fixture parameters, not recommended settings.
For reproduction, the low component is 0.020 sin(220 Hz) + 0.006 sin(660 Hz), and the wanted high marker is 0.003 sin(6000 Hz). Burst tone k, for k = 0…19, has amplitude 0.003, frequency 5100 + 200k Hz and phase πk(k−1)/20. Phases are evaluated using integer-reduced sample positions. Burst gain is 1 − 0.75E, where E is the burst’s raised-cosine envelope; its 480-frame ramps use endpoint divisor 479. The 2400-frame outer ramps use divisor 2399. Extended removal ramps down over 480 frames at the burst start, stays at zero until 12000 frames after its end, then ramps up over 480 frames. These are our explicit construction rules.
Original synthetic demonstration
Compare where and when constructed gain acts
Turn playback volume down first. Synthetic tones only; no speech or music. The highest delivered sample peak is approximately −28.25 dBFS. Do not turn up frequencies your listening path does not reproduce. Listening is optional.
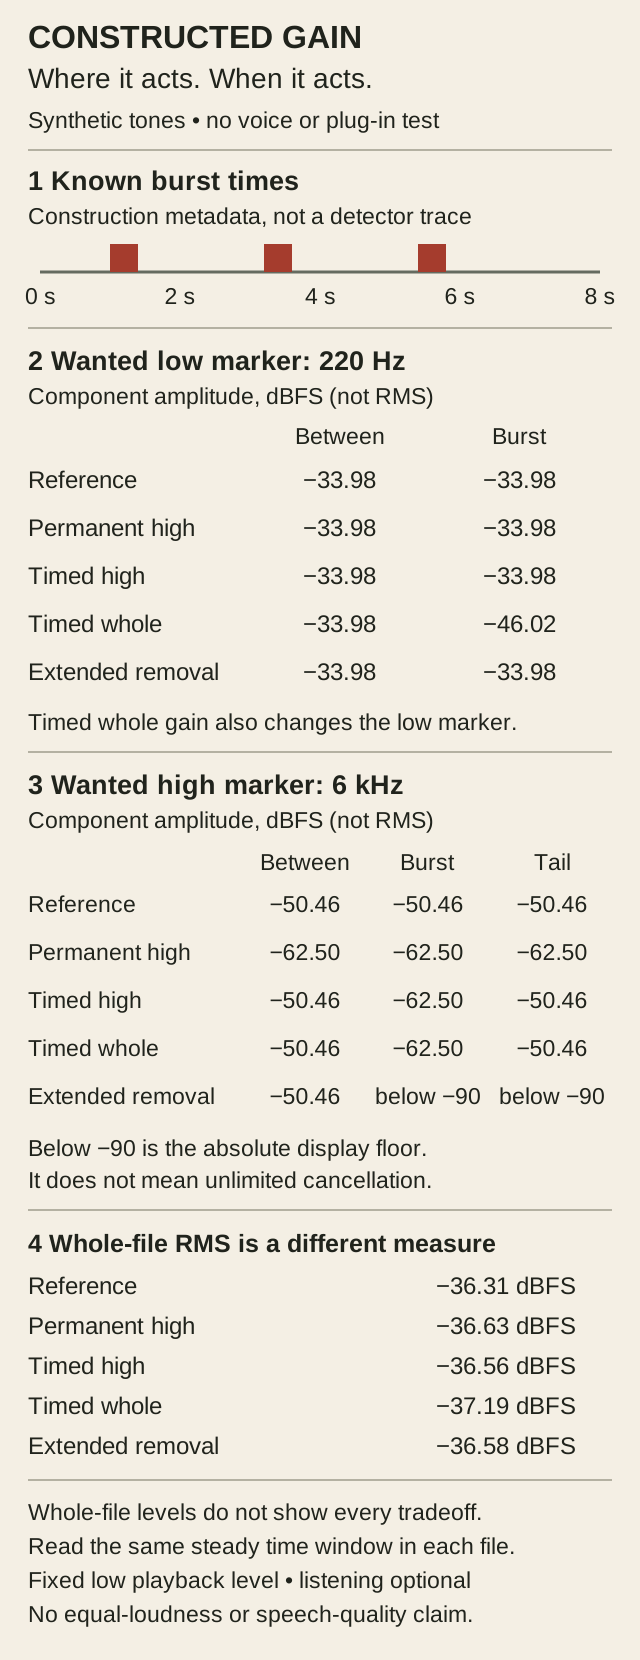
Five original constructed gain comparisons: known burst times; measured wanted 220 Hz and 6 kHz amplitudes during and between bursts; extended removal affects the high marker after the burst. Whole-file RMS is shown separately. Synthetic tones, no speech, real equalizer, detector or de-esser test; no audibility or equal-loudness claim.
Use one fixed low playback volume without changing it between files. Equal loudness is not claimed. Read the whole-file RMS and the wanted high-marker amplitudes beside each download; component amplitudes are not RMS. The same burst reduction can have different effects between bursts or on the low marker. Fixture frequencies and gains are not presets.
1 Reference
Whole-file RMS −36.31 dBFS. Wanted 6 kHz component amplitude: between (0.60–0.80 s) −50.46; burst (1.10–1.30 s) −50.46; after (1.45–1.60 s) −50.46 dBFS.
Download sibilance-reference.wav · WAV (48 kHz, 16-bit PCM; mono) · 8 seconds · 768,044 bytes
File integrity
SHA-256: b7627967e3b13994a01a81c2843c1ac78436de03aed7625e3df48b8637ae02e4
2 Permanent high component
Whole-file RMS −36.63 dBFS. Wanted 6 kHz component amplitude: between (0.60–0.80 s) −62.50; burst (1.10–1.30 s) −62.50; after (1.45–1.60 s) −62.50 dBFS.
Download sibilance-static-band.wav · WAV (48 kHz, 16-bit PCM; mono) · 8 seconds · 768,044 bytes
File integrity
SHA-256: 4e3d744aac2de8baeab53a60bde9d0091edde4e104a318960452b126dd05b375
3 Timed high component
Whole-file RMS −36.56 dBFS. Wanted 6 kHz component amplitude: between (0.60–0.80 s) −50.46; burst (1.10–1.30 s) −62.50; after (1.45–1.60 s) −50.46 dBFS.
Download sibilance-timed-band.wav · WAV (48 kHz, 16-bit PCM; mono) · 8 seconds · 768,044 bytes
File integrity
SHA-256: 68287e081efda8d62512dfa7f9774cc1aae7cf0d5895b88d6c369f6ed9b5dc92
4 Timed whole mixture
Whole-file RMS −37.19 dBFS. Wanted 6 kHz component amplitude: between (0.60–0.80 s) −50.46; burst (1.10–1.30 s) −62.50; after (1.45–1.60 s) −50.46 dBFS.
Download sibilance-timed-broadband.wav · WAV (48 kHz, 16-bit PCM; mono) · 8 seconds · 768,044 bytes
File integrity
SHA-256: bf9b03599f152a1a73b17bd88e9ce1f8e67293a7be95e36d1572215e94c0d1c9
5 Extended high removal
Whole-file RMS −36.58 dBFS. Wanted 6 kHz component amplitude: between (0.60–0.80 s) −50.46; burst (1.10–1.30 s) below −90; after (1.45–1.60 s) below −90 dBFS.
Download sibilance-overprocessed-band.wav · WAV (48 kHz, 16-bit PCM; mono) · 8 seconds · 768,044 bytes
File integrity
SHA-256: e99e6d08897e56197e7f86904f1a7931822fa9e8c9e14233d5ea35e0354121a6
Generated and measured by StudioSignalLab on November 1, 2026. Shipped files are pinned by hash. These examples contain no speech, music or hardware capture. Method fixed and independently reviewed before first generation. Two shipped-byte decoders, two identical fresh regenerations and a differently structured reconstruction match all PCM samples; analytic component amplitudes, Goertzel and Decimal RMS checks agree. The bursts are twenty coherent tones, not speech or noise. Gains and event times are construction metadata, not an automatic detector, real EQ/crossover or a vendor de-esser. No voice, microphone, application or speech-quality test.
Delivered measurements: wanted components and burst windows
The table separates whole-file RMS from peak-equivalent amplitudes of individual coherent components, all in dBFS. It uses between-burst 0.60–0.80 s, burst 1.10–1.30 s and post-burst 1.45–1.60 s windows. The 6 kHz marker is wanted content in this construction; it is not a speech or audibility measure. Values are rounded for display.
Decoded PCM: whole-file RMS and wanted-component amplitudes (dBFS; different measures).
- 1 Reference: whole-file RMS −36.31; 220 Hz during burst −33.98; 6 kHz between −50.46, during burst −50.46, after burst −50.46 dBFS.
- 2 Permanent high component: whole-file RMS −36.63; 220 Hz during burst −33.98; 6 kHz between −62.50, during burst −62.50, after burst −62.50 dBFS.
- 3 Timed high component: whole-file RMS −36.56; 220 Hz during burst −33.98; 6 kHz between −50.46, during burst −62.50, after burst −50.46 dBFS.
- 4 Timed whole mixture: whole-file RMS −37.19; 220 Hz during burst −46.02; 6 kHz between −50.46, during burst −62.50, after burst −50.46 dBFS.
- 5 Extended high removal: whole-file RMS −36.58; 220 Hz during burst −33.98; 6 kHz between −50.46, during burst below −90, after burst below −90 dBFS.
Permanent and timed high-component gain give the same steady burst result: the constructed 20-tone group falls from approximately −40.46 to −52.50 dBFS RMS. Between bursts, the permanent operation still reduces the wanted 6 kHz marker; the timed operation preserves it in those steady windows. Timed whole-mixture gain also reduces the wanted 220 Hz component during a burst. Extended removal leaves the high marker below the −90 dBFS display floor in the post-burst window. These are measured differences in known components, not a ranking of vocal processing.
Whole-file RMS spans only about 0.88 dB across the five files even though the steady burst group changes by about 12.04 dB in files 2–4. Averaging the entire file can conceal a local change. Similar whole-file RMS does not establish equal perceived loudness.
We also checked the recovered 2.00–2.20 s, second-burst 3.30–3.50 s, third-burst 5.50–5.70 s and late-between 6.50–6.70 s windows. All seven windows contain integer cycles of every constructed frequency and lie outside ramps. Coherent projection measures each known frequency separately; the 20-tone group RMS is calculated from those twenty amplitudes, not the full high-frequency spectrum.
Two parsers agree on every delivered PCM value. Two fresh generations and a differently structured reconstruction match every sample. All 805 component/window comparisons agree with the analytic amplitudes within the predeclared 1/32768 amplitude bound; the largest observed error is approximately 0.035 PCM least-significant-bit equivalent. A separate Goertzel calculation confirms the projections. Whole-file and window RMS were checked from exact integer sums of squares at 50-digit decimal precision. Values below the −90 dBFS display floor are reported as such, without claiming infinite rejection.
Read the comparison without assuming equal loudness
Compare the same time region at one fixed low playback volume. The whole-file RMS values are shown beside the downloads because the processing changes the delivered level. We do not claim equal loudness, a preferred sound or audibility of individual measurement markers. Listening is optional; do not raise the volume to chase a frequency your listening path does not reproduce.
The low-marker and high-marker projections ask different questions. The 220 Hz component reveals whether a whole-signal operation also changes the low component. The 6 kHz marker reveals what happens to wanted high content inside and outside the scheduled interval. The 20-tone group is measured separately so it cannot silently stand in for the complete high component.
A measured reduction in this constructed burst does not measure consonant intelligibility or establish which mode will work best on a real recording. A successful arithmetic comparison is a reason to check a corresponding tradeoff in the actual phrase, with the original preserved.
Return to the actual voice and verify the export
- Keep the marked problematic and wanted phrases available. Record the processor, version, actual mode and previous settings. Use the documentation for the controls that your product exposes.
- On the working copy, locate the target using the available audition or analysis view. Apply a conservative change and compare the whole phrase, surrounding words, pauses and unaffected passages. The fixture’s 6 kHz marker is not a recommended detector frequency.
- Check for newly missing or changed consonants and unwanted changes between targeted moments. Reduce the change or restore the original when the result does not support it. A larger gain-reduction display is not the acceptance test.
- Reopen a short export and compare it with both the original and project. Confirm wanted words, timing and channel content, then keep the settings and result with the source. The exact processing or capture stage still matters.
Use the existing guide when the main fault is different
Microphone technique owns placement and repeatability. The changing-volume guide covers automatic gain and compression over time; the gate guide covers lost quiet words; the hum guide covers steady tonal interference. Duplicate paths and clipping have separate diagnostic guides. Use those observations to choose the next comparison rather than treating every unwanted sound as sibilance.
Sources and verification
Claims were checked against the following first-party documentation on November 1, 2026. Product capabilities can change; verify current documentation before buying or changing a production system.
Frequently asked questions
Do harsh S sounds prove my microphone is faulty?
No. Compare the untouched saved phrase, processing stages, export and playback routes. A similar sound can lead to different investigations, and neither our synthetic examples nor one meter diagnoses a microphone fault.
What frequency should I use for every voice?
There is no universal value established by these examples. Locate the relevant material in the actual phrase with the controls and audition functions your product documents. The demonstration’s 6 kHz tone is a measurement marker, not a preset.
Is a permanent EQ cut the same as a de-esser?
A permanent change and a signal-dependent change have different timing. A de-esser’s detector and processed range also depend on the product. Our permanent high-component gain illustrates one arithmetic case; it is not a measured EQ filter or a test of an installed de-esser.
Does more gain reduction mean a better result?
Check the whole phrase and surrounding wanted material. Excessive processing can remove content you need. Our numerical example measures the loss of a known marker; a real voice still needs its own consonant and phrase review.
Are these WAVs recordings of sibilance or tests of a plug-in?
No. They are original synthetic tonal components and predetermined gain schedules. They contain no voice, microphone capture or automatic detection and cannot establish speech intelligibility or the performance of a commercial processor.