Tutorial · Research edition
Microphone Buzzing or Humming? Trace the Noise Before Filtering
Trace steady microphone hum through recording and monitoring. Compare six original WAVs to see 50/60 Hz harmonics and the cost of narrow versus broad filtering.
A steady low hum under a recording calls for a different investigation from a sharp click, a broad hiss or words cut off by a gate. First establish whether the noise exists in the saved source, the project, the export or only the current monitoring path. Keep the original and compare the same passage before buying equipment or applying a stack of effects.
A peak near 50 or 60 Hz can guide an investigation, but it cannot identify an electrical fault or prove a ground loop. Our six downloadable synthetic examples show how a fundamental and its harmonics behave under a narrow notch, a wide notch and several targeted notches. The examples teach a filtering tradeoff; they do not diagnose your microphone.
First, locate the stage that contains the hum
- Save an untouched source and make a working copy. Note the file, application, input, output and processing used. Record whether the sound is steady, changes with activity or appears only in one listening route.
- Play the untouched file in a second player and another known working output path if available. Keep the listening level low. If the same noise follows the file, investigate the captured signal; if it is absent there, compare the project and current monitoring chain. One clean route is evidence, not proof that the whole system is fault-free.
- Compare a short export with the source and project. Processing can reveal or add a problem, while monitoring can make a clean file sound noisy. Record the earliest stage at which the unwanted component becomes observable.
- When checking external audio connections, stop recording, mute outputs and follow each device manufacturer’s connection and power instructions. Change one ordinary audio-path variable at a time. Do not disconnect protective earth, modify a mains plug, open powered equipment or use your body as a grounding experiment. If you notice unusual heat, a burning smell, shocks or damaged plugs or cables, stop using the equipment and seek qualified service. Do not install a ground lift or mains-side device as a test.
Hum, buzz, hiss and clicks are different clues
A stable low-frequency tone and related peaks are useful clues for narrowband investigation. A harsh buzz can contain many harmonics, and other interference may not sit at 50 or 60 Hz at all. A broad noise floor or a short transient needs a different comparison. Do not label every unwanted sound “ground loop”.
Focusrite describes several possible grounding and interference paths for noise in interfaces and monitors. Its documentation includes trying another computer or location and examining connected equipment and cables. Those are scoped investigative suggestions, not proof that your microphone, USB cable or power supply is the cause. Use only tests appropriate to the equipment and its instructions.
Audacity distinguishes steady noise reduction from repair of individual clicks and pops. A noise-only profile can help its Noise Reduction effect, but wanted sound overlapping the noise limits the result. Use the dedicated Crackling guide for isolated transients and the OBS Noise Gate guide for level-dependent word loss.
Measure before choosing 50 or 60 Hz
In the documented Audacity Plot Spectrum workflow, a selected passage is represented by frequency and amplitude. A larger analysis size improves frequency separation while averaging over more time. A short or changing noise can therefore need a different selection; a single plotted peak is not a complete diagnosis. These are documentation-led pointers, not a verification of the interface on an installed Audacity version.
Inspect a suitable steady passage and note the peak frequencies, analysis settings and selection length. For real material, use a noise-only region where available and also inspect the same frequencies while wanted content plays. A peak at a harmonic can belong to the source you want to keep.
Audacity’s notch-filter documentation describes inspecting frequencies above the fundamental as well as the fundamental itself. A single cut at 50 Hz does not automatically cut 100 or 150 Hz; choosing a broad cut just to catch more components can also remove useful neighbouring material.
Our measured example: six files and a nearby wanted tone
Each example is eight seconds, mono 48 kHz, 16-bit PCM: 384,000 frames and 768,044 bytes. The clean synthetic reference contains 55, 220 and 660 Hz components. The 55 Hz component is deliberately close to 50 Hz so that collateral filtering is visible; it is not a model of a typical voice or a microphone recording. There is no speech, music or hardware capture. We express decoded levels relative to 32,768 integer units for full scale.
The 50 Hz mixture adds tones at 50, 100 and 150 Hz; the alternative mixture adds 60, 120 and 180 Hz. The inputs are constructed, with known component identities. A real recording does not provide those labels automatically. All examples use the same fixed gain, no normalization and a short outer fade. Listening is optional.
We implemented the notch formula attributed to Robert Bristow-Johnson in the W3C Audio EQ Cookbook. The 50 Hz comparison uses one notch with Q = 20 and one with Q = 1; a third version cascades Q = 20 notches at 50, 100 and 150 Hz. These are our own numerical filters, not Audacity effect exports, and the values are fixture parameters rather than recommended settings for every recording.
We measured component amplitudes from the delivered, quantized WAVs over the same six-second interior window, from 1.000 to just before 7.000 seconds. In the unfiltered 50 Hz mixture, the 50 Hz component measures −40.00 dBFS and the wanted 55 Hz component −32.04 dBFS. The narrow notch changes the 55 Hz component by −0.29 dB; the wide notch changes it by −14.54 dB. This measures a constructed component’s amplitude, not speech intelligibility or perceived quality.
After the single narrow notch, the remaining 100 and 150 Hz components measure −46.03 and −52.04 dBFS. The three-notch version reduces those selected components too, while changing the wanted 55 Hz component by −0.30 dB relative to the same unfiltered mixture. Values below −90 dBFS are displayed as < −90, a conservative reporting floor for this example, not a claim of absolute silence or a universal PCM noise floor. The clean reference is measured at the same hum frequencies as a control; the deep-notch residuals are quantization-limited, so they do not establish a numerical filter depth.
The exact reference frequencies allow direct sinusoidal projections over an integer number of cycles. This is not the FFT display or interpolation used by Audacity. Separate decoders check RIFF data and measurements; independent reconstruction and repeated generation check the delivered bytes. The fixture cannot establish how a plugin, changing hum or real speech will behave.
Original synthetic demonstration
Compare hum reduction with the cost to a neighbouring tone
Turn playback volume down first. Synthetic tones only; no speech or music. Every peak is at or below −23.41 dBFS. Do not turn up a tone your listening path does not reproduce. Listening is optional.
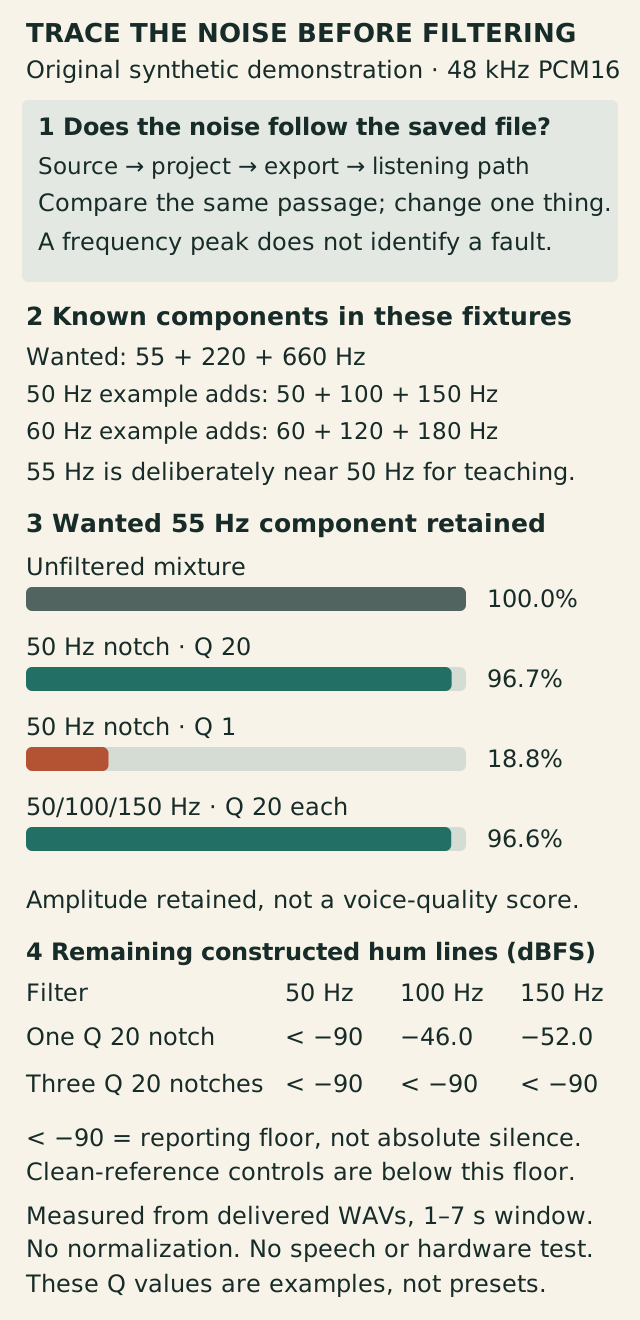
Original synthetic comparison: identify the stage first; compare known 50/60 Hz components; a Q 20 notch retains about 96.7% of the wanted 55 Hz amplitude, versus about 18.8% for Q 1. A single notch leaves selected harmonics; a cascade reaches the reporting floor. No hardware test.
Compare the same passage at one fixed low playback volume. Read both the residual hum lines and the wanted 55 Hz component. The display floor is −90 dBFS; deep-notch residuals are quantization-limited, not a measurement of unlimited filter depth. Q values and selected frequencies are fixture parameters, not presets.
1. Clean synthetic reference
Wanted components at 55, 220 and 660 Hz. The nearby 55 Hz tone is a teaching choice, not a voice model.
Download hum-reference.wav · WAV (48 kHz, 16-bit PCM; mono) · 8 seconds · 768,044 bytes
File integrity
SHA-256: 95fcf41cf35ac3aa1db9e07452f10c1292235f49bb64ec24a2ad27d84fcb0e5c
2. The reference with constructed 50 Hz hum
Adds 50, 100 and 150 Hz components. No microphone or electrical circuit was recorded.
Download hum-50hz.wav · WAV (48 kHz, 16-bit PCM; mono) · 8 seconds · 768,044 bytes
File integrity
SHA-256: 0ddc69e393fc497fbf6d63de73095f7098e1f943f703eb3c8bcd589d073ad39e
3. The reference with constructed 60 Hz hum
Adds 60, 120 and 180 Hz components. This file is not a mismatched-filter test.
Download hum-60hz.wav · WAV (48 kHz, 16-bit PCM; mono) · 8 seconds · 768,044 bytes
File integrity
SHA-256: fae06695c44324c4766d3a287913c2cb222d1af2069ccd68ca75f53b0fa86878
4. A 50 Hz notch with Q 20
Same input as file 2. The wanted 55 Hz component changes by approximately −0.29 dB; 100 and 150 Hz remain.
Download hum-50hz-notch-narrow.wav · WAV (48 kHz, 16-bit PCM; mono) · 8 seconds · 768,044 bytes
File integrity
SHA-256: c0a9e6c76774d84c3ff57b4b0f74b0c52a4108b2483020309a10c9d0177558fe
5. A 50 Hz notch with Q 1
Same input as file 2. The wanted 55 Hz component changes by approximately −14.54 dB. This does not establish voice quality.
Download hum-50hz-notch-wide.wav · WAV (48 kHz, 16-bit PCM; mono) · 8 seconds · 768,044 bytes
File integrity
SHA-256: 835c6387e11a94e0a90b8f9f34c47b1131a593507bc9a8e5ad31671cdf73344e
6. Three selected notches, Q 20 each
Same input as file 2, filtered at 50, 100 and 150 Hz. Selected residuals reach the reporting floor; wanted content at these frequencies would also be affected.
Download hum-50hz-harmonics.wav · WAV (48 kHz, 16-bit PCM; mono) · 8 seconds · 768,044 bytes
File integrity
SHA-256: 134c81e1bcd1670df24873af3b94241e0680ff0cb705698a860e4969d56f4606
Generated and measured by StudioSignalLab on October 31, 2026. Shipped files are pinned by hash. These examples contain no speech, music or hardware capture. Method fixed before the first generation and independently reviewed. Standard-library binary64 arithmetic with explicit nearest-even PCM rounding; two decoders, an independent complex transfer-function check, a differently structured filter reconstruction and two matching regenerations on the stated platform. Own W3C-cookbook-based filters, not installed Audacity effects or hardware tests.
Read the comparisons without turning the hum up
Use the waveform measurements and diagram first. If listening, keep one low playback volume for all files. Do not turn up a low-frequency tone until it becomes audible; your output path may reproduce it poorly. A quieter filtered file is not automatically a better recording.
Compare the same passage in the unfiltered 50 Hz mixture and the narrow and wide versions. Check both unwanted components and the known wanted 55 Hz component. For the 60 Hz example, inspect its different frequency labels; do not assume a 50 Hz setting addresses it.
The cascaded example removes only the chosen frequencies, and also affects wanted material at or near those frequencies. We are not recommending three fixed cuts for every hum. A real recording may drift, have different harmonics or contain important wanted energy in the same band.
If the hum is already in the saved recording
- Work on a duplicate and identify a short representative passage, including wanted material and an exposed noise region if available. Record the actual peak frequencies rather than guessing a country preset.
- Test the smallest reversible change that addresses a demonstrated component. In a notch filter, inspect both frequency and width. Audacity documents the Q control as a width control; preserve a before/after excerpt and judge wanted material as well as noise.
- If other unwanted peaks remain, inspect them individually instead of broadening the first cut without evidence. Avoid removing harmonic content just because it falls near a multiple of 50 or 60 Hz.
- Compare at fixed playback volume, reopen the export outside the project and confirm the intended duration and channels. Keep the unprocessed take. If the wanted content and interference overlap too much, a usable backup or a new recording can be preferable to more aggressive filtering.
If the noise is only in monitoring
A saved file that sounds clean on another known working route shifts attention to monitoring or playback. Compare the application output, interface headphone route and other connected audio equipment using the manufacturer’s instructions. Note which paths actually change; avoid changing several things at once.
For the recording side, a short controlled test with a known working compatible cable or input may help narrow the case, but stop and mute before connection changes and follow the device manual. Do not buy an isolator, change a driver or alter grounding solely because the sound resembles a demonstration.
Do not confuse two monitored copies of a microphone with hum. If the sound is delayed or doubled, use the existing OBS Echo guide. If words disappear only when channels are combined, use the Mono guide. Those articles own different faults.
Why a gate or lower master level is not a hum repair
A gate can hide noise in pauses while leaving it present under wanted sound. It can also damage quiet words; our OBS Noise Gate article covers that separate tradeoff. Turning down a master level scales both signal and noise rather than selectively removing a tone.
Audacity’s Noise Reduction documentation warns that similar noise and wanted-signal frequencies can prevent a satisfactory result. A noise-only profile is evidence about a particular region, not permission to process every file identically. Compare the result in context and retain the source.
Keep a short noise-investigation worksheet
- Observation: exact source file, passage, time, input/output route, processing and whether the noise follows the file. Leave unknown fields unknown.
- Spectrum: selection length, analysis settings, observed frequencies and whether they persist while wanted content plays. Keep a screenshot or exported measurements when available.
- Test: one reversible audio-path or processing change, its before/after setting and the same comparison passage. State whether you tested recording, playback or an offline export.
- Acceptance: unwanted component reduced without unacceptable loss of wanted content, export reopened, duration/channels checked and original retained. Record remaining uncertainty; one successful test is not a universal electrical diagnosis.
Sources and verification
Claims were checked against the following first-party documentation on October 31, 2026. Product capabilities can change; verify current documentation before buying or changing a production system.
Frequently asked questions
Does a 50 or 60 Hz peak prove a ground loop?
No. It identifies a component to investigate, not its electrical cause. Compare recording and monitoring paths and use the equipment manufacturer’s guidance. Our examples are constructed tones, not a hardware diagnosis.
Why does a 50 Hz notch leave some buzz?
A noise can contain harmonics or unrelated components outside that narrow band. Inspect the actual remaining frequencies and wanted material before applying more cuts.
Why can a hum filter make wanted audio thinner?
The filter acts on all content in the affected band. Our deliberately nearby 55 Hz wanted tone shows how a wider 50 Hz notch removes more neighbouring material. It does not measure voice quality.
Will a noise gate remove hum during speech?
Not selectively. A gate can close in pauses but lets the mixed signal through when open. It can also cut quiet words, which is a different fault.
Were these recordings made with a noisy microphone or Audacity?
No. The WAVs are original numerical constructions using a documented notch formula. No microphone, interface, electrical circuit or installed application was tested.